Data visualization. How to make it understandable
Every now and then, I see visualizations that completely confuse me. I can see what’s shown on the chart. But my brain can’t assess the proportions or understand why this visualization exists at all. To figure out how to “read” such a chart, I need time.
Does this sound familiar?
I’m sure it does. Because unreadable, confusing charts and strange infographics are everywhere. I could say the problem is me, that I’m missing something. But I’ve been comfortable with maps and charts since childhood, and as an adult I’ve designed dashboards myself. So what does an average user feel when looking at a beautiful but incomprehensible chart?
Nothing good. They feel: 1) stupid, 2) frustrated, 3) deceived.
Data visualization is supposed to simplify complex things. To make them clear. To save people time and cognitive effort.
But if a visualization has to be “studied” just to understand basic proportions, it’s no longer a tool. It’s a puzzle.
Understanding why this happens, and how to avoid it, is a kind of magic key to creating a usable tool. One that makes life easier and helps people like the product.

1. There is no special audience. There are just people
Designers often assume that if they’re building a dashboard for analysts, those guys are smart and will instantly understand any chart.
That’s a misconception. Yes, someone used to charts will spend less time on a design puzzle. But not always.
Some forms of visualization require mental operations that the brain handles poorly or slowly.
Any human brain.
There are different types of visual perception. But they are not fixed. The same person can switch strategies depending on the situation and context. Most of the time, context changes how data is read more than any innate perceptual type.
So what actually helps some people understand charts faster, while others don’t?
The answer is experience. Repetition that turns into automation. If someone has worked with charts for years, their experience differs from that of a beginner. Experienced users don’t read bad visualizations better. They just learn how to tolerate them.
Now imagine this situation. An analytics team is used to working with bar charts. Suddenly they are “blessed” with a new design: donut charts. Cover your ears so you don’t hear the angry screams. Yes, over time people will get used to it. But at first, it takes more time and causes irritation.
When someone is used to reading data automatically, any new form is initially perceived as a downgrade, even if it is potentially richer.
This is a pitfall in testing.
A visualization that doesn’t speed up work is considered bad by default in an analytical context.
At the same time, early testing may not be representative. People simply need time to switch to a new type of design.

2. The myth of dominant perception types
It’s impossible to determine that one audience understands certain charts better, while another understands different ones.
There is no reliable data on fixed perception types. But there are proven facts about which visualizations the human brain reads faster and more easily.
Designers, I have bad news for you. Pretty donuts and pumpkin pies are understood far worse than simple bar charts.
Most people compare lengths and positions best.
Length-based forms (bar, line) are read more easily by the majority of people. This is one of the most reliable findings in data visualization research, according to Cleveland & McGill.
This is not a “perception type”. It’s a perceptual advantage.
Most people are worse at comparing angles, areas, and volumes.
That means circles, bubbles, and radial forms are problematic for most people, not just for “certain audience types”.
Most people need verbal support.
Text matters for a broad audience. Research consistently shows that labels, annotations, and explanations improve understanding for almost all users.
3. How visualization affects perception
Just as perception affects how charts are understood, charts also shape perception.
The chosen chart type determines how people understand and interpret information. Charts can easily become manipulative. And this isn’t always intentional.
Why does this happen?
Because people see first and think second. A chart forms an impression before critical thinking kicks in. Once the impression is formed, logic often just justifies it.
Most people trust visuals more than words.
A chart is perceived as:
- objective
- technical
- “numbers are not an opinion”
Small visual decisions create large shifts. Manipulation can come from:
- a truncated axis
- scale selection
- chart type
- color
- category order
Technically, there may be no data falsification. But form and presentation distort perception.
Some forms are manipulative by nature.
For example:
- 3D
- circles with close values
- radial charts
- dual axes
They exaggerate differences or, on the contrary, smooth them out in ways that are not obvious to the reader.
Manipulation begins not where there is intent, but where form pushes the viewer toward a conclusion and leaves no room for doubt.
Data visualization is not neutral packaging. It is a tool of influence. And designers should understand their responsibility.

4. There is no bad perception. There is bad design
Bad design is design that ignores the essence of the task, ignores cognitive load, or exists purely for its own sake. Just to look pretty and impressive.
An aesthetic-minded designer thinks like this: “These bar charts make the design monotonous and boring. Let’s add a pie chart for some dynamics.” Or: “All the charts are gray. I want a bright accent. Let’s make this one blue.”
As a result, in the first case the design ends up with an unnecessary, poorly readable pie chart that breaks the overall logic. In the second case, a manipulative shift of emphasis occurs (the blue chart feels more important than the gray ones).

5. There are no problematic users. There is problematic visualization
Most problematic visualizations have one thing in common: they require people to do what the brain does poorly — compare areas, angles, volumes, and perspective.

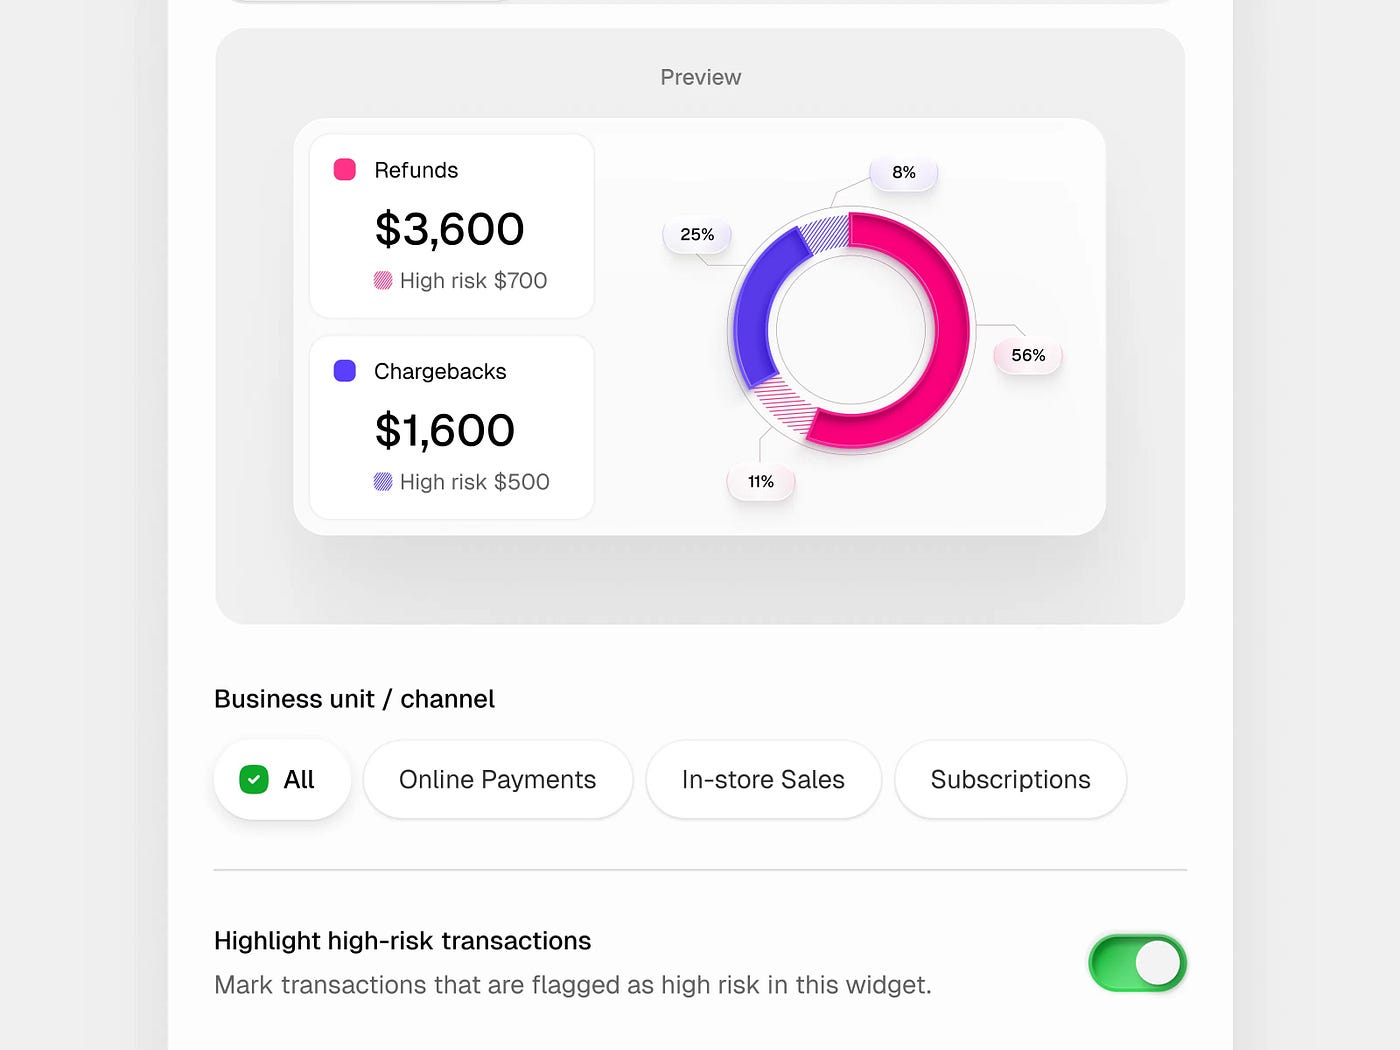
There are other issues as well. For example, the donut chart is extremely popular. Guess where the user’s eye goes first? To the center of the donut — into emptiness. The brain reads this as “a hole, nothing.” The wider the hole, the worse it gets.
The most difficult and problematic types of data visualization
1. Donut instead of pie
Often presented as an improved version of a pie chart, but in reality:
- the central hole removes the reference point
- area comparison becomes even harder
- labels are usually pushed outside (the eye jumps around)
Justified only if:
- there is a single key number in the center (and it truly matters)
- there are few segments with large differences
In all other cases, a donut is simply a more harmful pie. Nothing more.
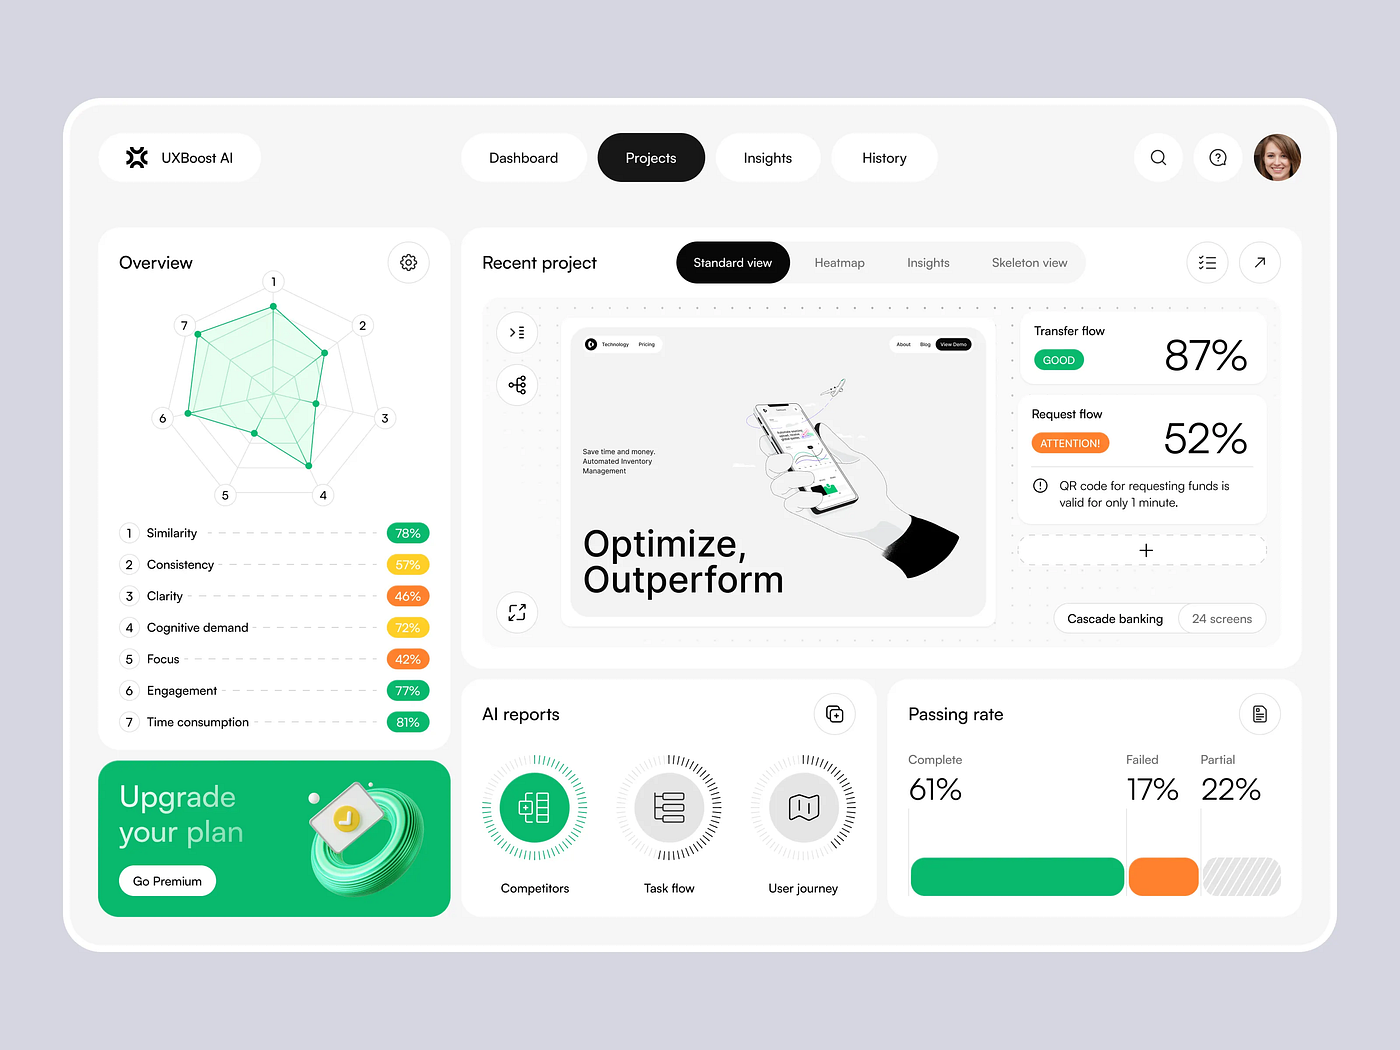
2. Radar / spider charts
Favorites of presentations and strategy slides. People see them and think, “This shape looks more powerful.” But they don’t understand what exactly is bigger and by how much.
Problems:
- no linear scale for comparison
- angles and shapes create an illusion of importance
- area is read emotionally, not logically
Justified:
- almost never in analytics
- sometimes in high-level storytelling, if no decisions will be made based on the numbers
3. Bubble charts
Especially problematic with different radii and colors.
Problems:
- the brain compares circle areas poorly
- bubble size is often overestimated
- adding color and position overloads perception
That’s already 3–4 parameters at once. For most people, it’s too much.
Justified if:
- distribution matters more than precise comparison
- there is interactive support with tooltips
- the audience is prepared
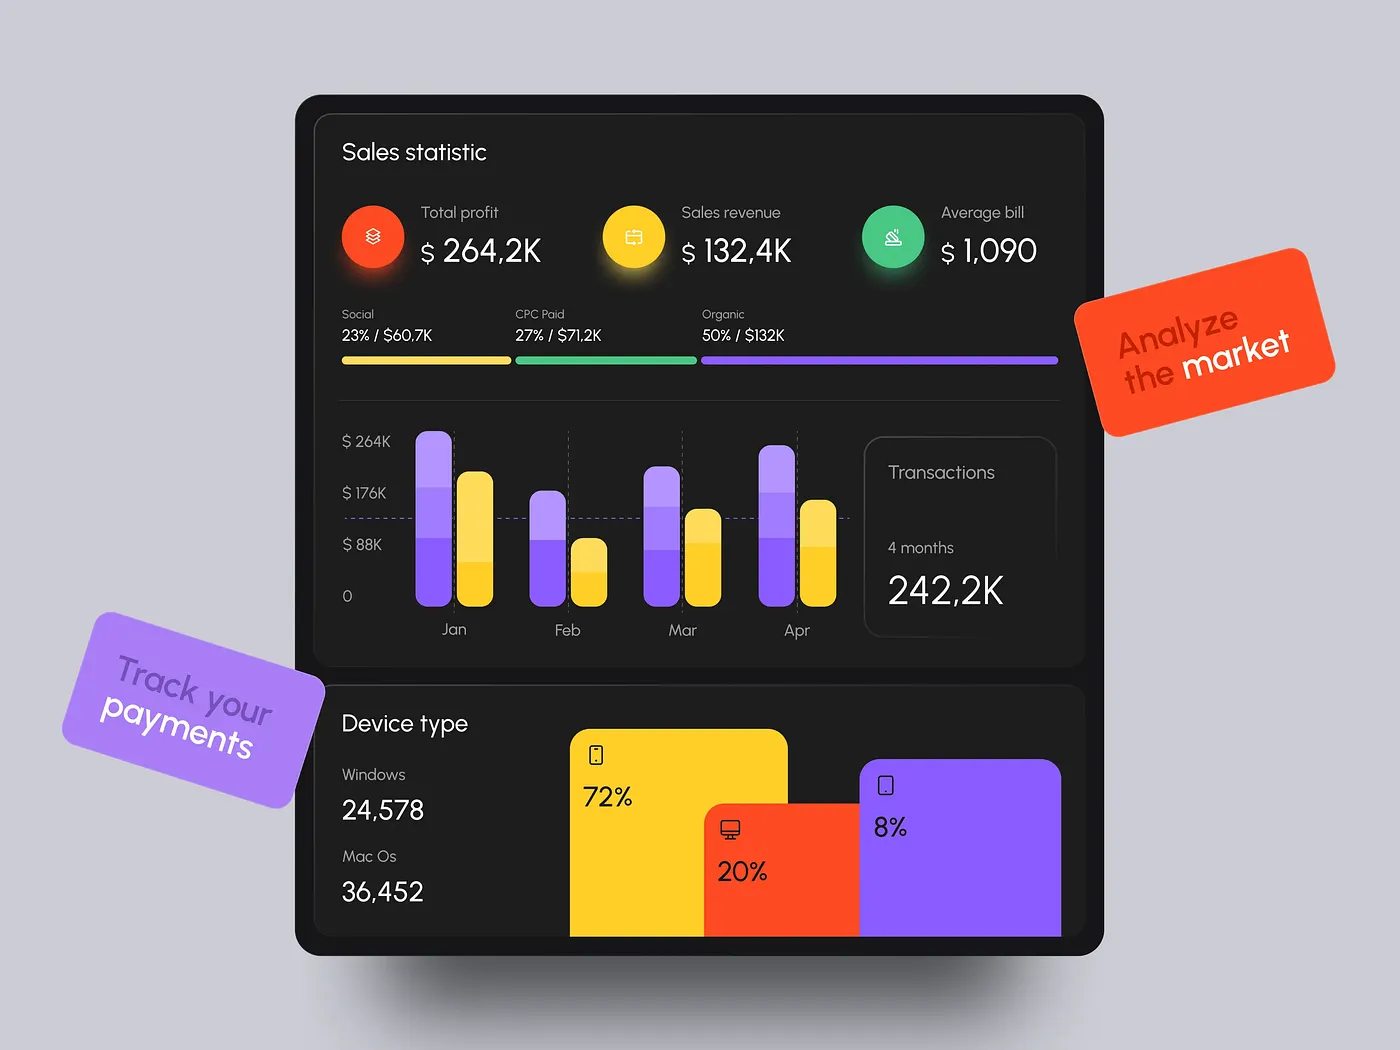
4. Stacked bar charts
A tricky one.
Problems:
- only the first segment is easy to compare
- all other segments “float” without a common baseline
- comparisons between bars quickly break down
Justified if:
- you need to show structure within a single bar
- comparisons across multiple bars are not required
As soon as comparison appears, reading and understanding errors begin.
5. Heatmaps without context
Very trendy and very dangerous.
Problems:
- color replaces numerical thinking
- without a legend and scale it’s pure emotion
- people read “red = bad / green = good” even when that’s not the case
Justified:
- as a density overview
- for anomaly detection
- as a first layer, not a final conclusion
6. Dual-axis charts (two y-axes)
Loved by analysts and hated by users.
Problems:
- create false correlations
- the eye automatically links the lines
- scale can be manipulative
Justified only if:
- the reader is explicitly warned
- the reader understands they are looking at different scales
Otherwise, they become a source of incorrect conclusions.

7. Sankey diagrams (flows)
Very impressive and very heavy.
Problems:
- difficult at first glance
- scale poorly
- require time and attention
Justified if:
- flows are the core meaning of the data
- this is the main chart, not a secondary one

Just now, I typed “bar chart” into Google. Do you know what came up at the top? “Bar chart: How to make it interesting and beautiful.”
The article talks about rounded corners (apparently so the brain clings harder to each rounded corner and gets tired faster). For those who want to stumble, there’s the lollipop chart. To make it hurt more, add tick marks. For lovers of philosophical contemplation of emptiness, an outline bar chart is suggested.
Users shouldn’t suffer for beauty.
Things like this don’t help retain users on the page. After breaking their brain on unnecessary cognitive barriers, people leave irritated.
We all love beautiful design. But let’s not forget that design should help people understand information, not get in the way.


